Saturday, September 2, 2017
Simulation of a Small Office Network in IT Guru
Simulation of a Small Office Network in IT Guru
Introduction
In this lesson, you will learn how IT Guru can model organizational scaling by using the tool to model a real-world �what if� problem. You will learn how to use
IT Guru features to build and analyze network models.
In this lesson, you will
� Build a network quickly
� Collect statistics about network performance
� Analyze these statistics
In this lesson, you use the Project Editor to build a topology of a small internetwork, choose statistics to collect, run a simulation, and analyze the results.
In this lesson, you plan for the expansion of a small company�s intranet. Currently, the company has a star topology network on the first floor of its office building and plans to add an additional star topology network on another floor. You will build and test this �what-if� scenario to ensure that the load added by the second network will not cause the network to fail.

Getting Started
When creating a new network model, you must first create a new project and scenario. A project is a group of related scenarios that each explore a different aspect of the network. Projects can contain multiple scenarios.
After you create a new project, you use the Startup Wizard to set up a new scenario. The options in the
Wizard let you
� Define the initial topology of the network
� Define the scale and size of the network
� Select a background map for the network.
� Associate an object palette with the scenario
Startup Wizard automatically appears each time you create a new project. The Startup Wizard allows you to define certain aspects of the network environment.
To use the Startup Wizard to set up a new scenario, do the following:
1 If IT Guru is not already running, start it.
2 Select File > New....
3 Select Project from the pull-down menu and click
OK.
4 Name the project and scenario, as follows:
4.1 Name the project <initials>_Sm_Int
Include your initials in the project name to distinguish it from other versions of this project.
4.2 Name the scenario first_floor.
4.3 Click OK.
? The Startup Wizard opens.
Enter the values shown in the following table in the dialog boxes of the Startup Wizard:


You can use any of three methods to create a network topology, or a combination of all three. One method is to import the topology (discussed in a later lesson).
Another is to place individual nodes from the object palette into the workspace. The third method is to use
Rapid Configuration.
Rapid Configuration creates a network in one action after you select a network configuration, the types of nodes within the network, and the types of links that connect the nodes.
To create the first-floor network using Rapid Configuration:
1 Select Topology > Rapid Configuration.
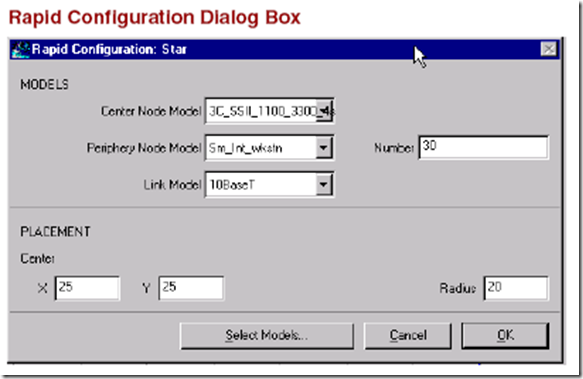
Select Star from the drop-down menu of available configurations, then click OK....

Specify the node models and link models in the network. Models follow this naming scheme:
<protocol1>_..._<protocoln>_<function>_<mod>
where:
� <protocol> specifies the specific protocol(s) supported by the model
� <function> is an abbreviation of the general function of the model
� <mod> indicates the level of derivation of the model
For example:
ethernet2_bridge_int
specifies the intermediate (int) derivation of a 2-port
Ethernet (ethernet2) bridge (bridge).
Vendor models have an additional prefix that specifies the vendor and the vendor product number for that particular network object.
For example, the 3Com switch used in this lesson is named:
3C_SSII_1100_3300_4s_ae52_e48_ge3
This node is a stack of two 3Com SuperStack II 1100 and two Superstack II 3300 chassis
(3C_SSII_1100_3300) with four slots (4s), 52 auto-sensing Ethernet ports (ae52), 48 Ethernet ports
(e48), and 3 Gigabit Ethernet ports (ge3).
To specify the nodes and links to use to build the network:
1 Set the Center Node Model to 3C_SSII_1100_3300_4s_ae52_e48_ge3. This is a 3Com switch.
2 Set the Periphery Node Model to Sm_Int_wkstn, and change the Number of periphery nodes to 30. This provides 30 Ethernet workstations as the peripheral nodes.
Set the Link Model to 10BaseT.
Specify where the new network will be placed:
1 Set the X center and Y center to 25.
2 Set the Radius to 20.

3 Click OK.
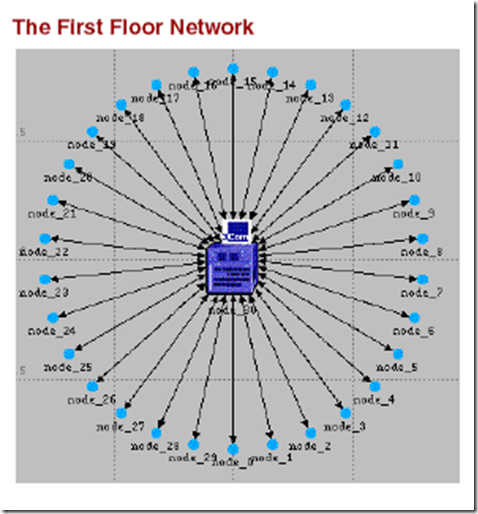
? The network is drawn in the Project Editor:

Now that the general network topology has been built, you need to add a server. You will use the second method of creating network objects: dragging them from the object palette into the workspace.
1 If it is not already open, open the object palette by clicking on the
Object Palette action button.

2 Find the Sm_Int_server object in the palette and drag it into the workspace.
You will not find this exact server model on other object palettes because we created it with the correct configuration for this tutorial.
By default, you can create additional instances of the same object by left-clicking after the initial �drag-and-drop� from the palette.
3 Because you do not need additional copies of this model, right-click to turn off node creation.
You also need to connect the server to the star network.
1 Find the 10BaseT link object in the palette and click on it.
2 Click on the server object, then click on the switch object in the center of the star.
? A link is drawn, connecting the two objects.
3 Right-click to turn off link creation.
Finally, you need to add configuration objects to specify the application traffic that will exist on the network. Configuring the application definition and profile definition objects can be complicated, so you do not have to do these tasks right now. For this tutorial, we included, on the object palette:
� an application definition object with the default configurations of the standard applications, and
� a profile definition object with a profile that models light database access
You need only drag the objects into your network. Doing so means that the traffic caused by workstations accessing a database at a low rate will be modeled.
1 Find the Sm_Application_Config object in the palette and drag it into the workspace
2 Right-click to turn off object creation.
3 Find the Sm_Profile_Config object in the palette, drag it into the workspace, and right-click.
4 Close the object palette.
The network is now built and should look similar to the following figure.

You are now ready to begin collecting statistics.
Collecting Statistics
You can collect statistics from individual nodes in your network (object statistics) or from the entire network (global statistics).
Now that you have created the network, you should decide which statistics you need to collect to answer the questions presented earlier in this lesson:
� Will the server be able to handle the additional load of the second network?
� Will the total delay across the network be acceptable once the second network is installed?
To answer these questions, you need a snapshot of current performance for comparison. To get this baseline, you will collect one object statistic, Server Load, and one global statistic, Ethernet Delay.
Server load is a key statistic that reflects the performance of the entire network. To collect statistics related to the server�s load, do the following steps:
1 Right-click on the server node (node_31) and select Choose Individual Statistics from the server�s Object pop-up menu.
? The Choose Results dialog box for node_31 appears.
The Choose Results dialog box hierarchically organizes the statistics you may collect. To collect the Ethernet load on the server:
2 Click the plus sign next to Ethernet in the Choose Results dialog box to expand the Ethernet statistic hierarchy.

3 Click the checkbox next to Load (bits/sec) to enable collection for that statistic.
4 Click OK to close the dialog box.
Global statistics can be used to gather information about the network as a whole. For example, you can find out the delay for the entire network by collecting the global Delay statistic:
1 Right-click in the workspace (but not on an object) and select Choose Individual Statistics from the
Workspace pop-up menu.

2 Expand the Global Statistics hierarchy.
3 Expand the Ethernet hierarchy.
4 Click the checkbox next to Delay (sec) to enable data collection.
5 Click OK to close the Choose Results dialog box.
It is good to get into the habit of saving your project every so often. To save the project:
1 Choose File > Save, then click OK (the project already has a name, so you don�t need to rename it).
Now that you have specified which statistics to collect and saved the project, you are almost ready to run your simulation.
First, though, verify that your repositories preference is set. Repositories contain user-defined components such as process models and pipeline stages that are saved so that simulations will take less time to begin execution.
1 Choose Edit > Preferences.
2 Type repositories in the Find field and click on the Find button.
3 If the value for repositories is not stdmod, click on the field and enter stdmod in the dialog box.
4 Click OK to close the repositories and
Preferences dialog boxes
To run a simulation:
1 Select Simulation > Configure Discrete Event Simulation�.
You can also open the Configure Discrete Event Simulation dialog box by clicking on the configure/run simulation action button.
2 Type 0.5 in the Duration: field to simulate one-half hour of network activity.

Click the Run button to begin the simulation.
While the simulation runs, a dialog box appears showing the simulation�s progress.

The dialog box above shows that, in 5 seconds of elapsed (actual) time, IT Guru has simulated 15 minutes and 19 seconds of network time. The entire simulation should take less than one minute to complete�the elapsed time varies according to the speed of your computer.
4 When the simulation finishes, the contents of the
Messages tab appears. Click the Close button in the Simulation Sequence dialog box.
5 If your simulation does not complete, if no results were collected, or if the results vary significantly from those shown, you will have to troubleshoot your simulation. See "Troubleshooting Tutorial Simulations".
Viewing Results
You can view results graphically in the Project Editor by selecting View Results from the Workspace pop-up menu.
After your simulation has executed, you will want to see the information collected for each statistic. There are several ways to view results; in this lesson you will use the View Results option in the Workspace pop-up menu.
You will learn different ways to view results in later lessons.
To view the server Ethernet load for the simulation:
1 Right-click on the server node (node_31) choose
View Results from the server�s Object pop-up menu.
? The node�s View Results dialog box opens.
2 Expand the Office network.node_31 > Ethernet hierarchy.
Click on the checkbox next to Load (bits/sec) to indicate that you want to view that result.
4 Click the Show button in the View Results dialog box.
? The graph of the server load appears in the Project Editor, as shown in the following figure.
The graph of the server load should resemble the following graph. Your results may differ slightly due to differences in node placement and link length, bu download file now
No comments:
Post a Comment
Note: Only a member of this blog may post a comment.